Вход
Mathematics for IGCSE & O level - Statistical Diagrams (Section 6 - No. 46)
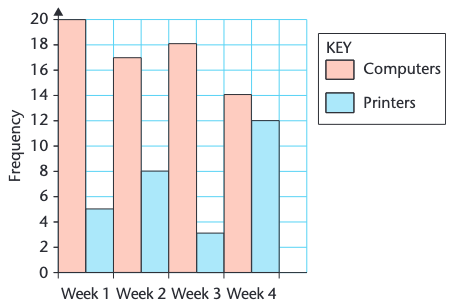
What is the total number of students shown in the chart below?
30
35
40
45
Обяснение
The students represent sales of Computers and printers (16+6+12+16+14+8 = 72)
Коментари (0)
Влезте, за да коментирате
Реклама
Разрешете на javascript да зареди правилно тази страница